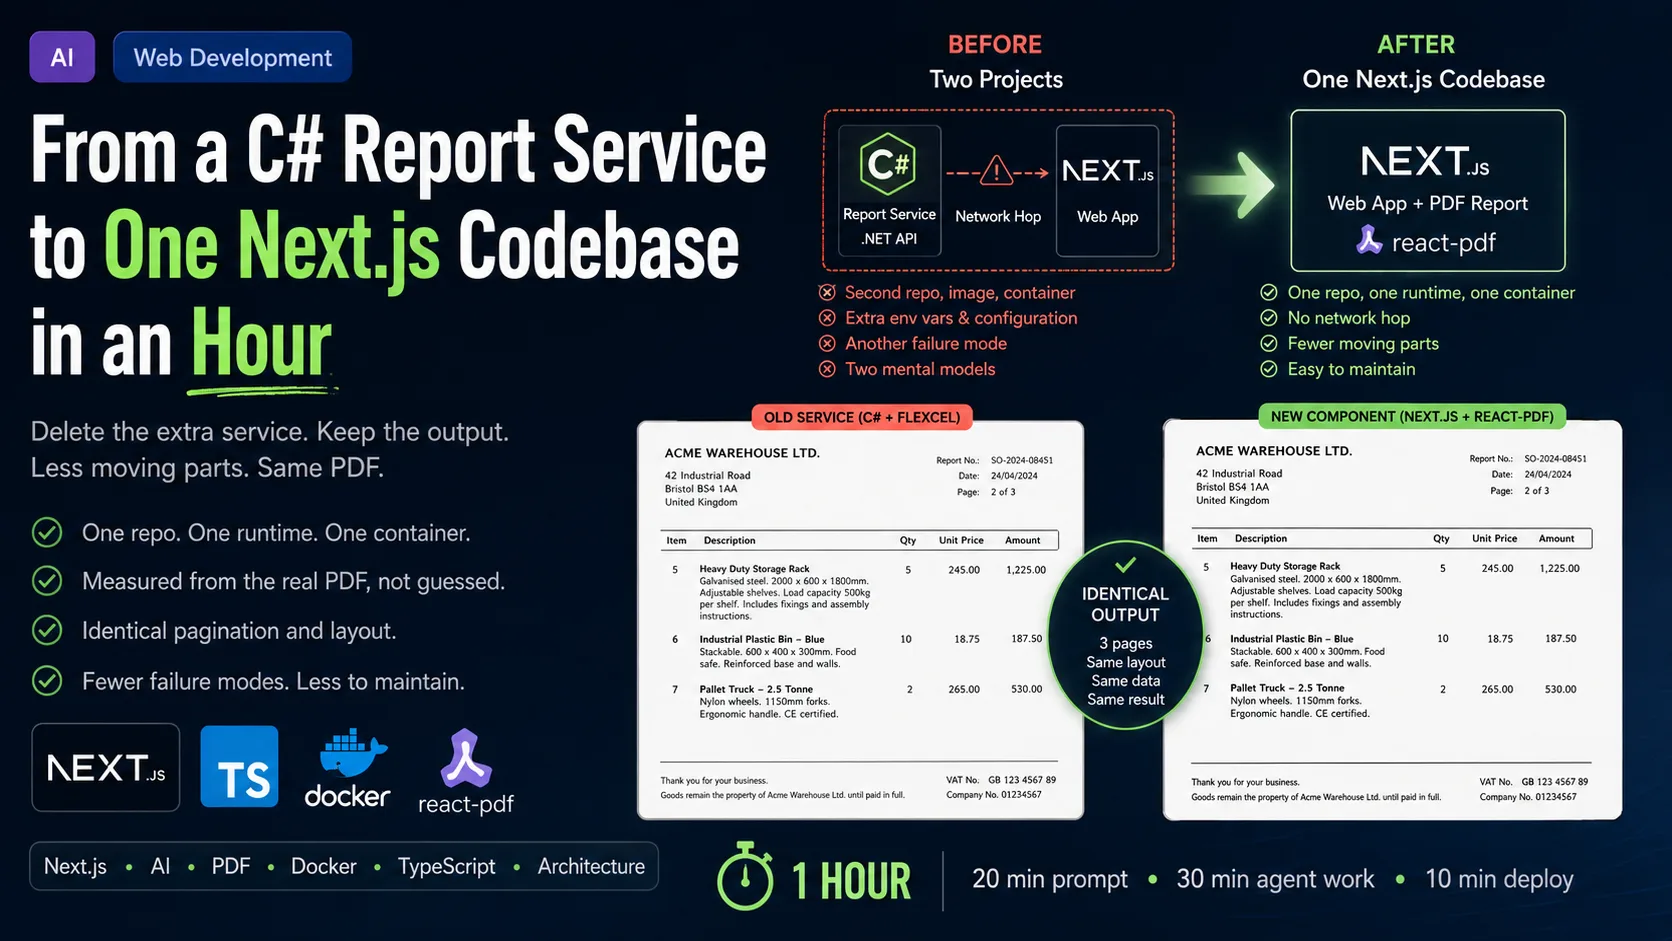
There is a particular kind of deployment mistake you only make once. You ship the app, watch it come up green, close the laptop — and the next morning someone tells you the print button says the report server is unavailable. The app was fine. The other thing was not.
For about a year, one PDF report in a warehouse application I maintain lived in its own service: a small C# web API that took a JSON payload, poured it into an Excel template, and handed back a PDF. It worked. It never crashed, never corrupted a page, never needed a fix. And I have just deleted it, because working correctly turned out to be the smaller half of what a piece of software costs you.
What made the deletion possible was not a new library. The library I used has been around for years and I had already rejected it for this job, for reasons that were good at the time. What changed is that the expensive part of using it — measuring a page, to the point — is now something I can hand to an AI along with a reference PDF and get back in half an hour.
Why there were two projects in the first place
The honest answer is that a year ago, splitting it out was the cheaper decision, and I would make it again with the same information.
The report is a dense one-page-per-few-items document: a letterhead, an address block, a metadata grid, and then a table of line items whose descriptions run to twenty lines each and paginate across as many pages as they need. Building that in a web stack meant one of two things. Either I paid for a commercial reporting engine, or I hand-built the layout in code — and in the JavaScript world, hand-building means react-pdf, an MIT-licensed React renderer that draws PDFs with flexbox-ish primitives instead of HTML.
react-pdf is a genuinely nice library. But designing in it is not the same as using it. You are positioning boxes in points on a 595 × 842 canvas, and every column width, every leading value, every margin is a number you have to arrive at somehow. There is no designer. There is no ruler. There is you, a pnpm dev loop, and a lot of squinting at a page that is almost right.
Against that, the alternative was almost unfair. TMS FlexCel is a component suite whose feature list includes a "Report Engine that allows to create complex reports using Excel as your report designer" and "100% Native PDF report generation from .XLS/.XLSX files" — and it ships a fully managed .NET edition alongside the Delphi one. So the design tool was Excel. I drew the report in a spreadsheet, put <#Title> and <#I.Text> placeholder tags in the cells, and FlexCel filled them from a list of objects and exported the result as a PDF. An afternoon's work, and the layout was drag-and-drop.
The catch was that FlexCel is .NET, and the application is Next.js — the React framework that runs your components on the server. Two runtimes, so two projects.
What the second project actually cost
The running cost of that service was near zero, which is exactly why it took me a year to notice what it was really charging me.
Nothing on that list is a bug. Every one of them is a small, permanent tax on attention:
- A second repository to clone, branch, and keep credentials for.
- A second language and toolchain — the .NET SDK on a machine that otherwise only needs Node.
- A second container image to build for two architectures and push to the registry.
- A second service in
docker-compose.yaml, with adepends_onand its own restart policy. - An environment variable pointing one at the other, which is wrong by default on every fresh checkout.
- A failure mode that has nothing to do with the report — the network hop between them — plus the branch in the UI to explain it to a user: the reporting server is not available, please try again later.
- And the thing you cannot enumerate: two mental models, only one of which is loaded at 11pm.
That last one is the real bill. The report was never hard. Remembering that the report was a separate thing was hard.
What I handed the AI
The whole job started with three artefacts and no explanation of how they fitted together.
I gave Claude Code — Anthropic's coding agent, which works in your terminal, your IDE and the browser — exactly this:
- The C# project source, all of about seventy meaningful lines: the request handler, the class that set the report values, and the call that exported the workbook to PDF.
- The Excel template, the
.xlsxfile itself, placeholder tags and all. - One PDF that the old service had actually produced, for a real order.
That third file is the one that matters, and it is the part I would tell anyone else to copy. The source tells you the data. The template tells you the intent. Only the generated PDF tells you the truth — what the engine did with the template after all its own rounding, scaling and page-fitting decisions.
Measuring instead of guessing
This is the step I could not have done by hand in a day, and it is the whole reason the migration was an hour rather than a fortnight.
The agent pulled the .xlsx apart — an Excel file is a zip of XML — and read the sheet geometry directly. The template turned out to be a uniform grid: thirty-two columns, every one of them exactly 2.5625 units wide, with the workbook's default font at 11pt. Every merged cell in the layout was therefore expressible as a span of grid columns, which is precisely the information a flexbox-style renderer needs.
Then it did the part I find genuinely delightful. It opened the reference PDF with pdfplumber, a Python library that reports the position of every word and rule on a page, and simply read the coordinates off the finished document:
x0=51.8  top=57.6   size=8.51   sender line above the address
x0=51.8  top=162.2  size=10.40  address block, first line
x0=51.8  top=231.4  size=13.24  report heading
         top=245.3            horizontal rule, x 50.4 → 540.1
x0=51.8  top=261.1  size=10.40  metadata row
x0=51.8  top=312.6  size=10.40  table header (repeats on every page)
Those numbers became a constants file. Not a guess refined by twenty screenshot comparisons — the actual printed positions of the document I was replacing, transcribed.
The reveal in that dump is the font sizes. They are not round numbers: 13.24, 11.35, 10.40, 8.51, 7.57. The reporting engine had scaled the whole sheet by about 94.5% to fit the print area, and nobody had ever needed to know that. Reading it off the output made it free.
The font trick that saved the line breaks
Changing the typeface should have wrecked every line break in the document, and the fix is a single ratio.
The template was set in Consolas, a Microsoft font, and the report service's repository carried four Consolas .ttf files next to the code so the renderer could embed them on Linux. Microsoft's own font redistribution FAQ is blunt about that arrangement — "Apart from the document embedding rights described previously, you may not redistribute the Windows fonts. You may not copy them to other computers or servers" — which makes copying them onto a server the one thing the guidance names outright. That was my oversight, carried for a year, and I would never have gone looking for it. Rewriting the thing is what made me look.
The replacement is JetBrains Mono, which is published under the SIL Open Font License 1.1 and covers every glyph the data throws at it — the umlauts, the ®, the Ø, the ≥. But a monospaced font is defined by one number, its advance width, and the two do not agree: Consolas advances 0.55 em per character, JetBrains Mono 0.60 em. Same point size, nine percent wider. Every wrapped line in every description would break somewhere new, and the page count would drift.
So don't keep the point size. Keep the physical character width, by scaling the sizes by the inverse of the ratio:
// Consolas advances 0.55em per character, JetBrains Mono 0.60em. Scaling the
// point sizes by the inverse keeps the same number of characters per line, so
// descriptions break where they used to and the report paginates the same way.
const CONSOLAS_TO_JBM = 0.55 / 0.6;

const consolas = (size: number) => size * CONSOLAS_TO_JBM;

export const SIZE_HEADING = consolas(13.24); // the report heading
export const SIZE_BODY = consolas(10.4); // address, metadata, table header
export const SIZE_TABLE = consolas(8.51); // line-item rows
Set out side by side, the two fonts land on the same character width from opposite directions:
The result, measured back out of the new PDF with the same tool, lines up with the original almost everywhere:
| Old service | New component | |
|---|---|---|
| Pages | 3 | 3 |
| Items per page | 1–4 / 5–9 / 10 | 1–4 / 5–9 / 10 |
| Page number, from top | 23.4pt | 23.4pt |
| Address block | 162.2pt | 162.2pt |
| Table header | 312.6pt | 312.4pt |
| Footer lines | 803.1 / 812.7pt | 803.1 / 812.7pt |
| Per-character advance | 4.6813pt | 4.6805pt |
I did not ask for that table. I asked whether the output matched, and got the evidence instead of an opinion — which, when you are about to delete a service that has worked for a year, is the answer you actually want.
What the rewrite turned up in the data
Two things surfaced that had been true for a year and invisible for a year, and both came from the AI looking at real data rather than at the schema.
The line-item descriptions are not plain text. Every one of the 3,011 rows in the database contains HTML, because the ERP's editor stores it that way and the old engine had an "HTML mode" flag switched on that quietly absorbed it. A survey of the actual column found a small, closed vocabulary and a lot of mess:
| Tag | Occurrences | |
|---|---|---|
<br /> | 14,571 | line breaks |
<strong> | 3,727 | product names and sub-headings |
<span style=…> | 157 | pasted from Word — mso-*, Calibri, colours |
<em> | 128 | italics |
<li> / <ul> | 73 / 15 | bullet lists |
Plus HTML entities in the thousands: ü 5,890 times, ä 2,591, ® 1,385. Had I ported this by hand from the C# source, I would have written text into a <Text> element, shipped it, and found out from a user that every description in the system now prints its own markup. Instead the markup got a proper little parser — nested tags, empty tags, stray whitespace and all — before a single line of layout code was written.
No engine — just a report
This is the shift that I think generalises past my one document, and it is worth saying plainly.
A reporting engine exists because writing bespoke layout code used to be expensive. That is its entire economic justification: you learn a template dialect, a designer, and a placeholder syntax once, so that you never have to compute a coordinate again. It is a very good trade when hand-building costs days.
When hand-building costs an hour, the trade inverts. What I have now is not a report tool — it is one report, expressed as ordinary React components in the same codebase as everything else, using the same TypeScript, the same lint rules, the same review process, the same deployment. There is no dialect. Ctrl+click on SIZE_TABLE goes to the line where the number came from and the comment explaining why it is that number.
And the reuse story is better, not worse. If a second report needs the same letterhead, that letterhead becomes a component and gets imported — which is the mechanism the framework already has, rather than a second mechanism the reporting tool brings along. Composition is the thing React is for.
What it costs to run now
The operational footprint is the part a customer notices, and it got smaller in every direction.
The PDF is rendered on the server — renderToBuffer returns Node bytes that go straight out of the route handler as application/pdf. Nothing is generated in the browser, so there is no browser-compatibility surface at all: the tablet in the warehouse and the twelve-year-old machine in the office get identical bytes, and printing behaves identically because it is the same file.
The whole application still runs in one Alpine Linux container — the base image is roughly 5MB, which is where the reputation comes from — on a small VPS. There is no headless browser in the image, no LibreOffice, no .NET runtime, and no second container to schedule alongside it. And react-pdf needed exactly zero configuration to work in the Next.js server bundle, because Vercel already list it in the framework's built-in external-packages list.
The hour, honestly accounted
The headline number is real, but it is worth breaking down, because the split is the interesting part.
- 20 minutes writing the prompt. The largest single block, and it should be. This is where you decide what the AI is allowed to assume, what the reference artefact is, and what "done" means.
- 30 minutes of agent work. Reading the C# service, unzipping the template, querying the real database for real descriptions, measuring the reference PDF, writing the components, and rendering test output to compare against.
- 10 minutes to deploy. One image instead of two.
Twenty of those sixty minutes were me typing English. That ratio is the actual story of this post: the scarce resource has moved from writing the code to specifying the problem and supplying the evidence. I have written about this shift before, when an AI turned a two-year project into a one-week sprint and when a native Delphi tool came together in one afternoon — this is the same phenomenon, applied to deleting something rather than building it.
Takeaways
The report was never the problem, and that is the whole lesson.
- Count what a separate project costs you in attention, not in CPU. A second repository, image, container, environment variable and failure mode are each nearly free and collectively expensive.
- An architectural decision can stay correct while its premise expires. Excel-as-designer was the right call when computing coordinates cost days. Re-examine the trades you made when the tooling changes, not just the ones that hurt.
- Give the AI the output, not just the input. The source and the template describe intent; only a generated document tells you what actually printed. That one PDF is why the new one paginates identically.
- Verification beats reassurance. "It looks the same" is worth nothing next to a table of measured coordinates from both documents.
The AI did not make the report better. It removed the reason the report had to live somewhere else.
If your stack has a small satellite project that exists purely because some job was awkward in your main language a year or two ago, it is worth an afternoon to ask whether that is still true. Mine wasn't. Don't be afraid of this new world — this is one more example of a codebase getting simpler to maintain, not more complicated.